|
Welcome to the homepage
of Interaction
Interaction is the only Windows software program specifically designed to draw and analyze statistical interactions! I developed this program because I was frustrated with how much time and effort it took to draw interaction graphs and analyze interaction statistics. Now it takes less than a minute! |
Interaction
is currently being used at hundreds of top institutions around the world! |
|
|
||
|
With Interaction you can:
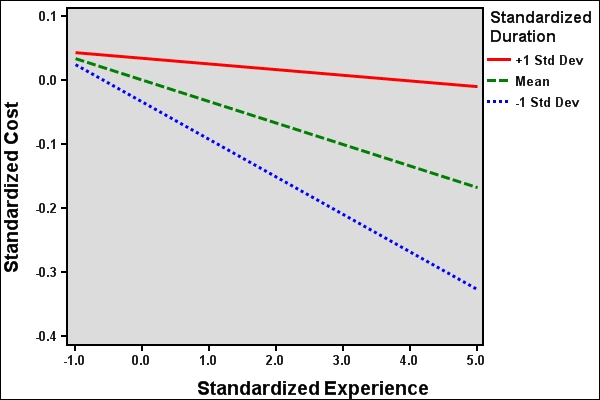
A sample Interaction graph is shown above. You can see more graph samples in the gallery. You can also see a sample of the comprehensive statistical output generated by Interaction by clicking here. You may also be interested in my Free Statistics Calculators - over 100 free online statistics calculators are now available! |
||

|