|
Welcome to the gallery!
Here you will find several screenshots and sample
interaction graphs generated by Interaction!
If you would like to view a sample of the statistical
output that Interaction! automatically generates,
click here.
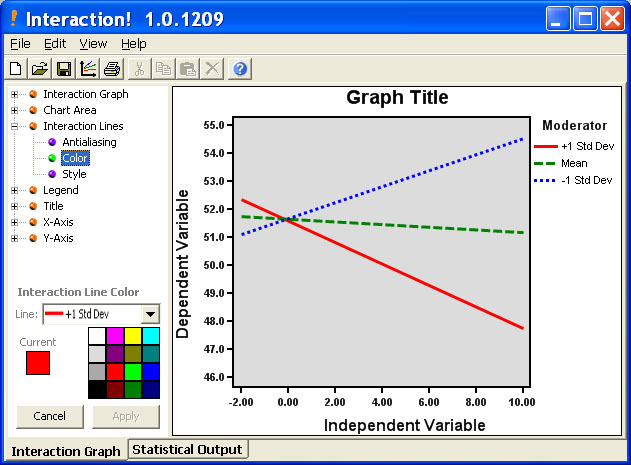
The screenshot above shows the primary user
interface. The interaction graph you are currently working on is always shown
on the right side of your screen. Modifications to your graph are very easy to
make -- you simply select which graph property you want to edit from the list
on the left, and the modification panel for that property automatically
appears!
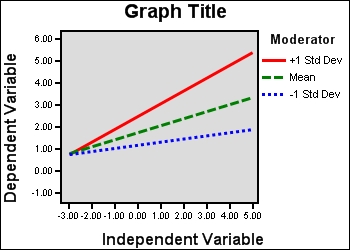
You can easily change the size of your interaction
graphs!
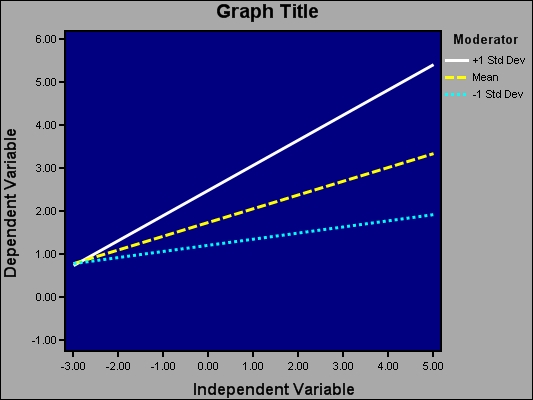
Colors are easy to change too!
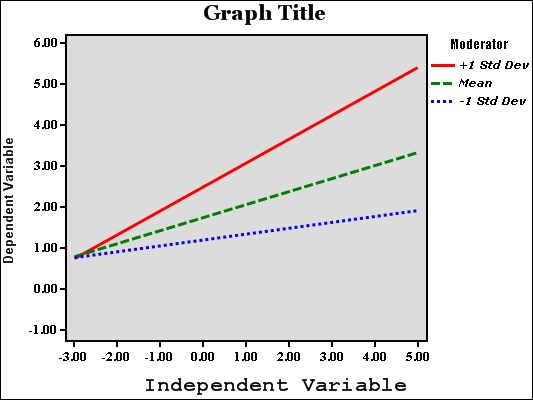
You have complete control over fonts and font
sizes...
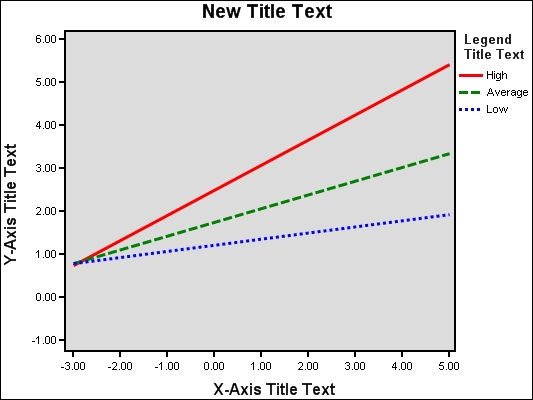
...and you can change the graph title, legend title,
axis descriptions, and line descriptions!
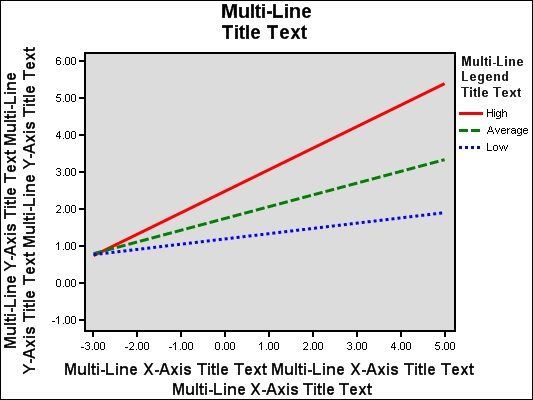
Multi-line text is OK...
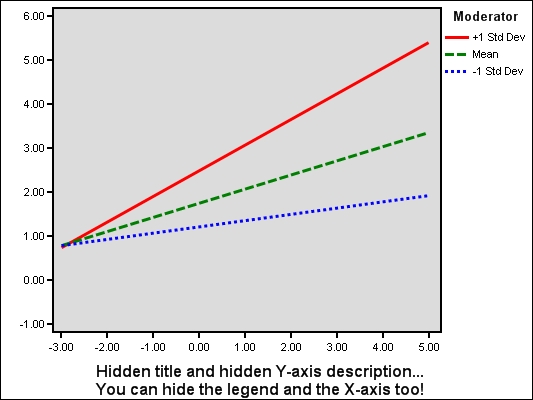
...so is no text at all!
You can also easily change the axis scaling and
decimal precision!
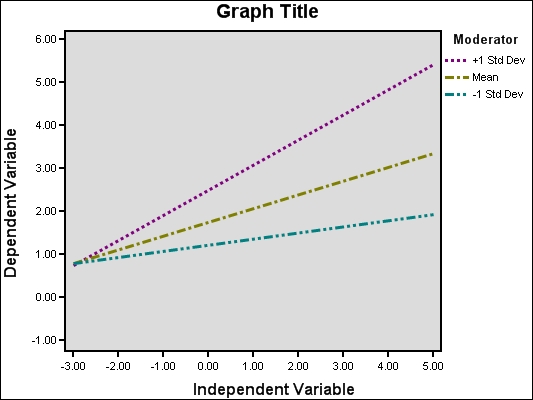
Need to change the style or color of the interaction
lines? No problem!
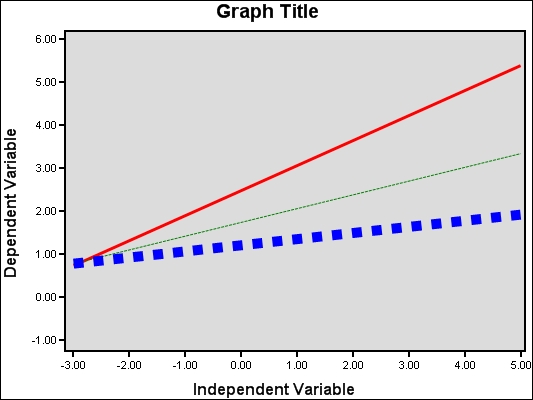
You can change the width of the lines too!
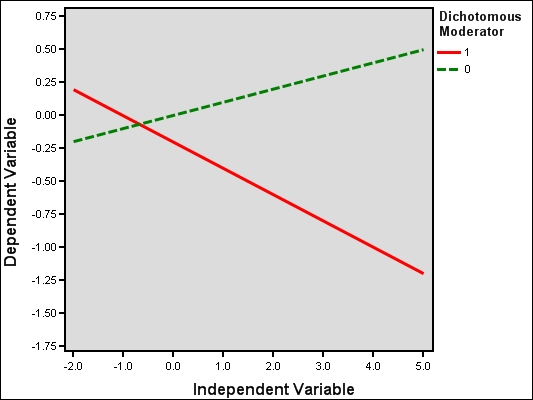
You can draw interaction graphs with dichotomous
moderators...
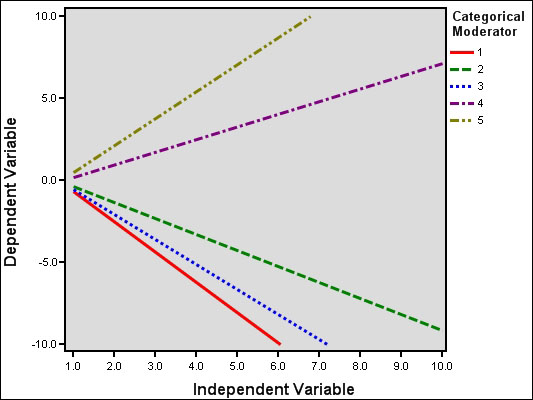
...categorical moderators (e.g. Likert scales)...
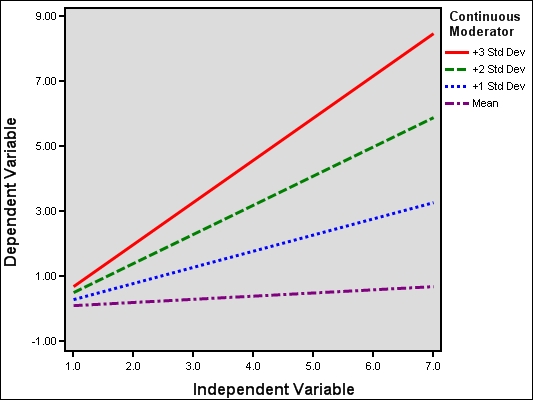
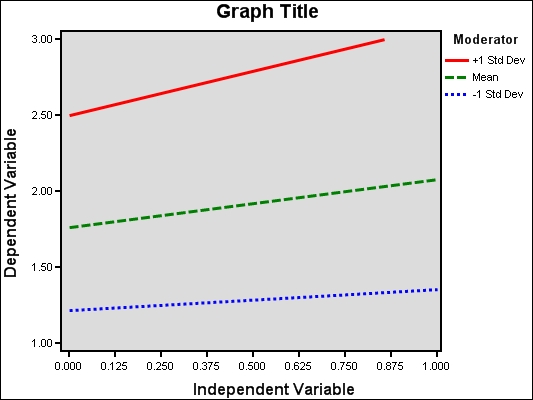
...and continuous moderators!
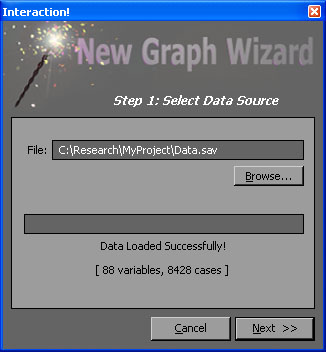
Perhaps best of all, Interaction!
provides you with a New Graph Wizard that allows
you to easily import your SPSS, Excel,
or tab-delimited data, and guides you through the
creation of your interaction graph!
You may also be interested in my
Free Statistics Calculators -
over 100 free online statistics calculators are now available!
|